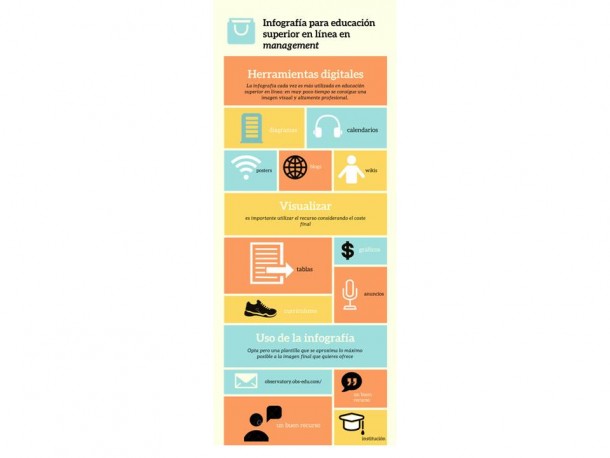
Infographics is increasingly used in higher education online. The main reason for this increase is linked to the fact that in a short time a very visual and highly professional representation of information is achieved. Currently, teachers, researchers and managers of online higher education institutions in management have a large number of digital tools to prepare infographics.
However, one disadvantage is that with these tools are that the users can download the infographic only if they have a commercial account. Without an account, the infographic must only be viewed through the main website. This makes these infographics useless in presentations, reports, posters or online publications.
OBServatory has used and evaluated the most common tools for infographics such as Visme, Canva Infographic Maker, Google Charts, Piktochart, Infogram, Venngage, easel, Creately, Chartblocks, Chartsbin, Photoshop and Geocommons.
After analyzing these thirteen infographics tools, comparing their use and identifying the strengths and weaknesses of each, we value some digital resources as more suitable for online higher education in management. Among the resources valued we highlight Piktochar, which allows free downloading of the infographic in PNG image format and Goolgle Charts that allows to copy the graphics, tables and calendars in html language. Piktochart makes it possible to prepare infographics, pdf presentations, posters, reports and flyers. Google Charts offers graphics, tables and calendars in a wide variety of formats.
The use of other resources such as Canva Infographic Maker, Visme, Infogram and Venngage are suitable for teachers, researchers and managers of higher education institutions in management online due to their functionality, but it is necessary to bear in mind that they entail a cost. Vizualize allows a very specific use since it is designed to prepare visual curriculums by obtaining information from Linkedln. Finally, Chartsbin allows to make interactive maps and publish them on the web page of the resource to present research data.

