Bar charts or sector charts are resources that online teachers often use to display information in a visual way. In many cases it is not enough that the data is correctly processed and displayed, but it is necessary to capture the students attention.
The columns diagrams, lines, circulars, bars or dispersion can be prepared with spreadsheets without difficulty but sometimes a greater effort is necessary to determine which is the best way to explain the history that underlies the analyzed data, which are the relationships between the data or which data are the most relevant.
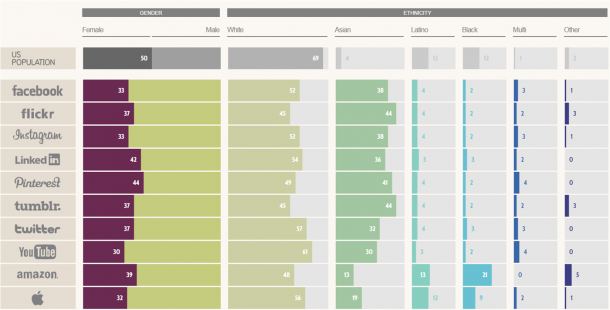
The website Information is Beautiful, by David McCandless, a British data journalist, analyzes data from various sources and poses very novel ways of displaying information.
Different types of graphics allow to show the information as a map allowing the quick relation between the figures, as graphs that visualize the hidden patterns in the data or as data related to temporary patterns, among others.
Kantar Information is Beautifull Awards gratifies the excellence and beauty of the data by awarding annual awards to data visualizations, infographics, interactive art and interactive information.